Profile takes readings from the RTU at a regular interval and records the readings in its own internal database. Profile keeps all stored data indefinitely.
The historical data interval is set by the system administrator and can be anywhere between 1 hour and 1 day.
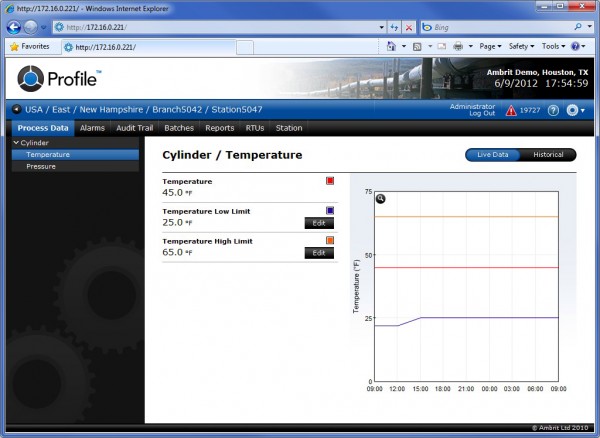
Fields that are being recorded will be displayed on the chart. The legend for the chart is shown next to the fields.
The chart on the Process Data page defaults to showing the last 24 hours.
If none of the fields on the screen have historical data, then the chart will not be shown.
1. Navigate to the station
See the ‘Viewing a Station’ section for more details.
2. Click the ‘Process Data’ tab in the Navigation Bar
3. Click the ‘Historical’ button
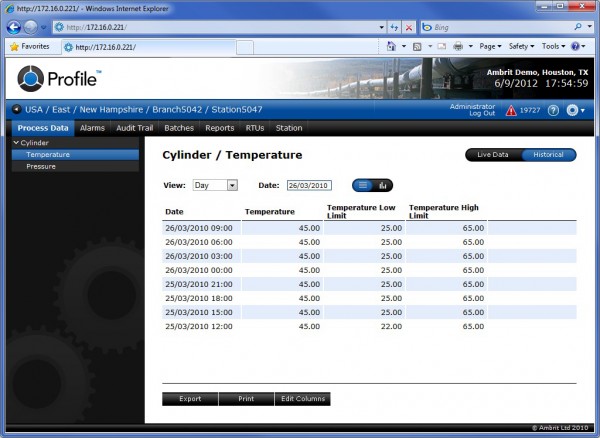
This will show data for the current 24 hours in tabular format.
3. Click the  button
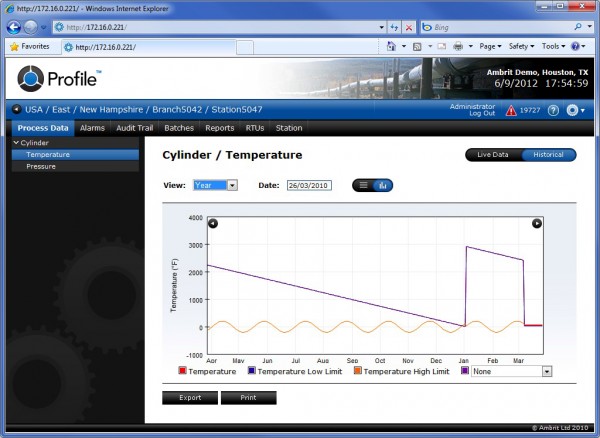
This will show the historical data presented as a chart.

4. Click the  button to view the chart for previous days
5. Use the ‘View’ popup menu to display a different charting period.
This will allow you to select either “Day”, “Week”, “4 Weeks” or “Year”.
6. Use the ‘Date’ popup menu to set the end date for the charting period
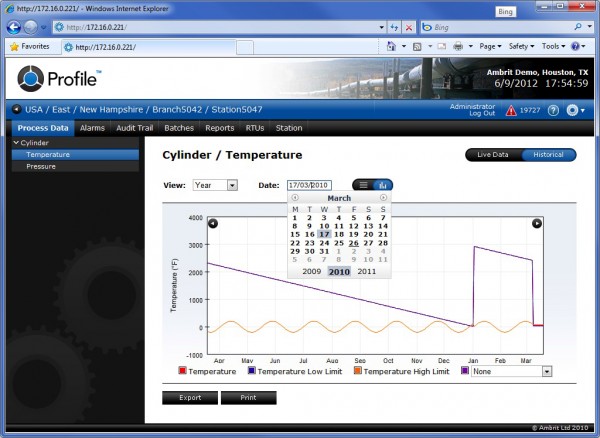
The selected date will always be shown on the right hand edge of the chart.