Viewing the Prove History Charts for a Meter
1. Click the ‘Approve’ tab in the Database Bar 1
2. Select the station in the Inventory Menu 2
This will show the latest proves from each meter run:
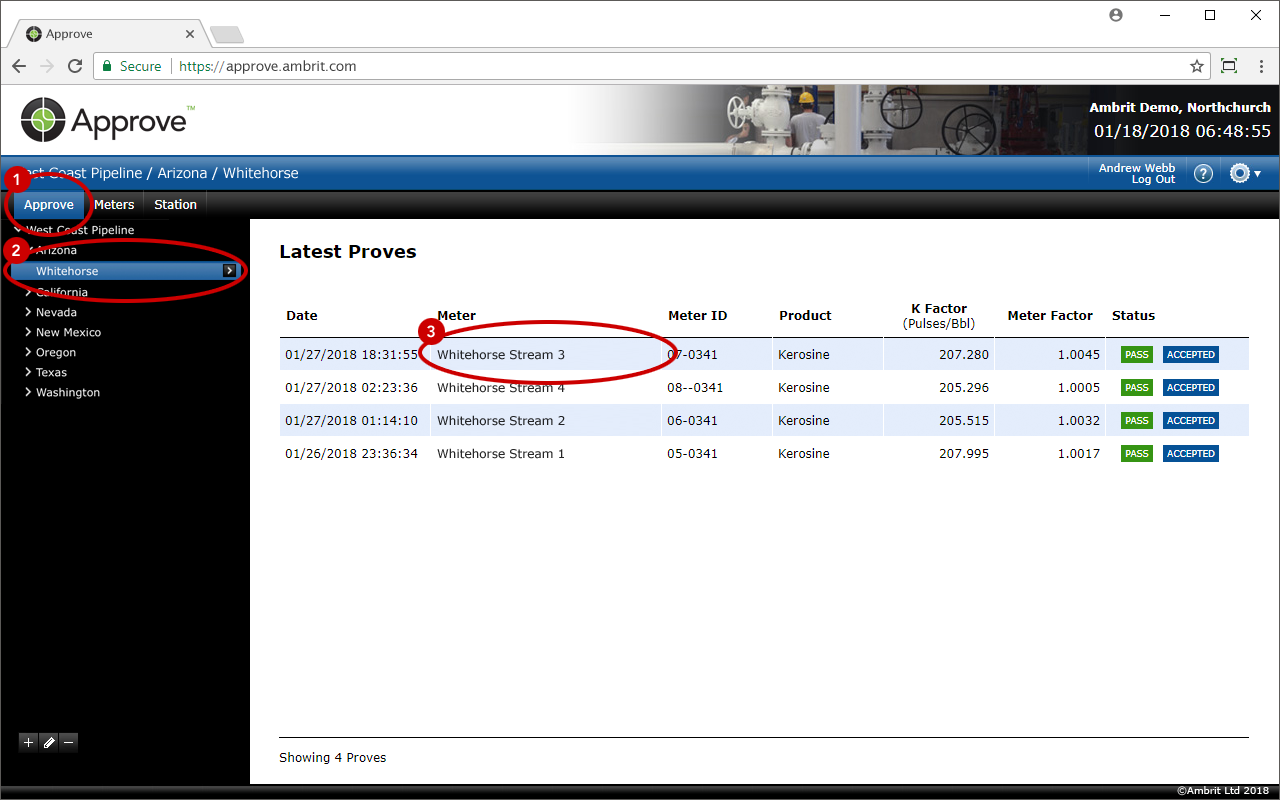
3. Click on the meter run in the Latest Proves list 3
This will show a history of all proves for the selected meter / product / base curve:
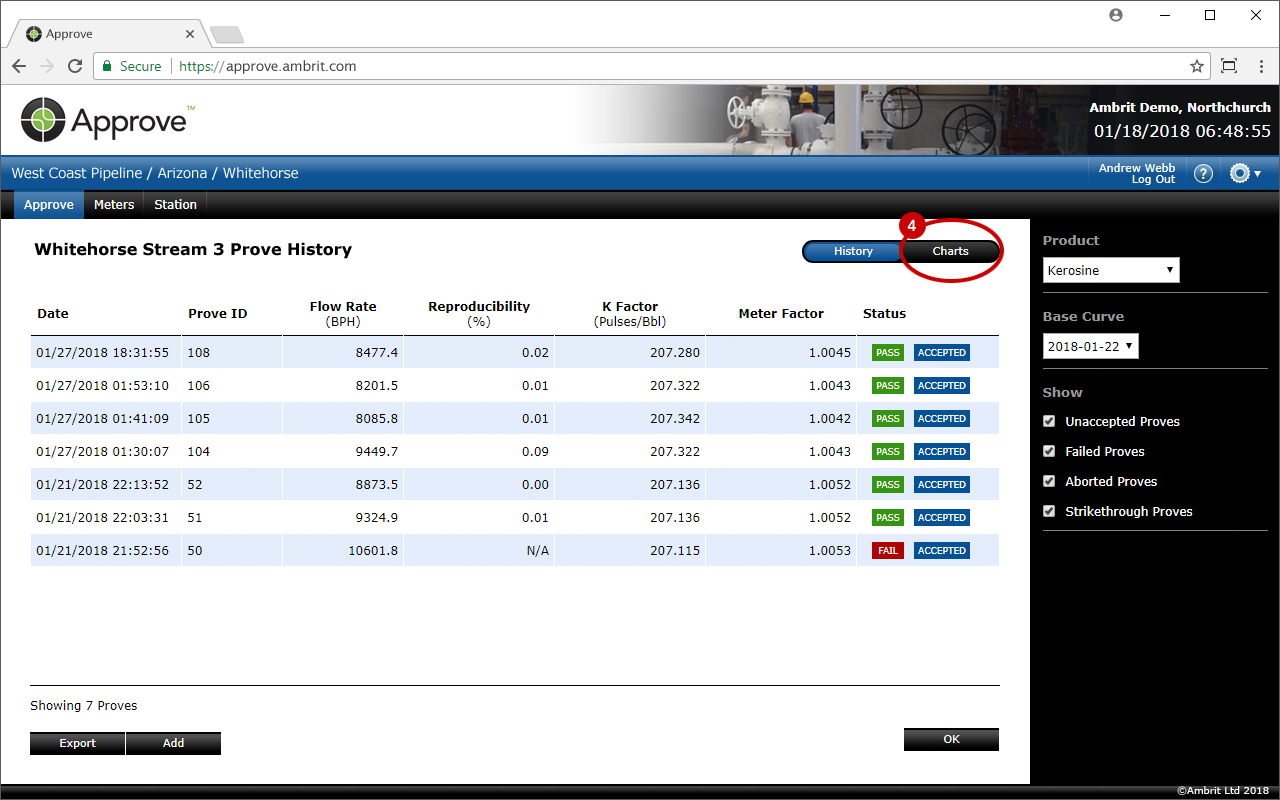
4. Click the ‘Charts’ tab 4
This will show the Flow Rate Linearisation chart for the selected meter / product / base curve:
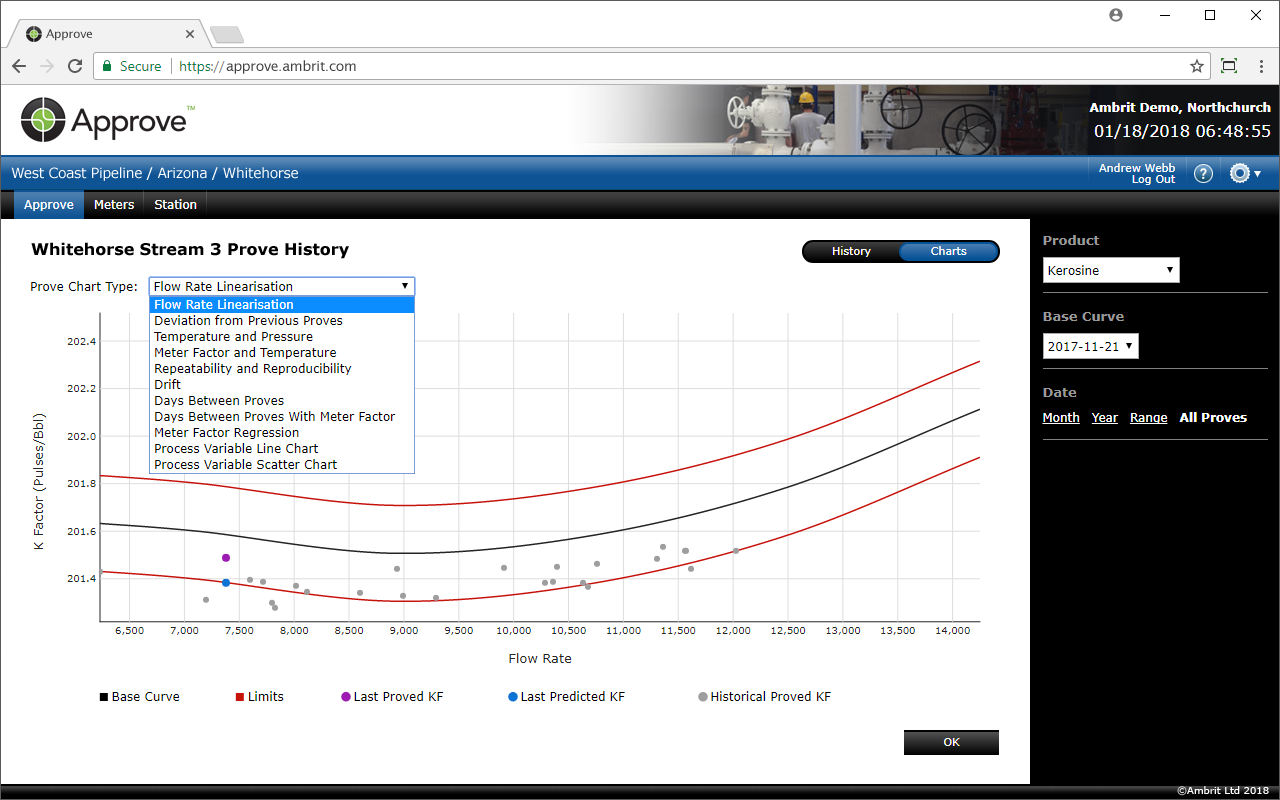
By default the product from the latest prove will be selected. To see the prove history for other products select the product in the ‘Product’ popup menu.
By default the latest base curve will be selected. To see historical base curves select the older base curve in the ‘base curve’ popup menu. If the meter has just been replaced or recalibrated then the current base curve may not contain any proves yet.
Use the date search to select the date range that you want to see. By default the charts will show the proves over the latest 30 days.
Select the type of chart from the ‘Prove Chart Type’ popup menu.
The following charts are available from the Prove Chart Type popup menu:
- Flow Rate Linearisation Chart
- Deviation From Previous Prove Chart
- Historical Temperature and Pressure Chart
- Meter Factor and Temperature Chart
- Repeatability and Reproducibility Chart
- Meter Factor Regression Chart
- Drift Chart
- Days Between Proves Chart
- Days Between Proves with Meter Factor Chart
- Process Variable Line Chart
- Process Variable Scatter Chart